
Giving admins more visibility and control over Claude spend
New analytics and cost controls are available for Claude Enterprise.
New analytics and cost controls are available for Claude Enterprise.
We’re introducing richer admin analytics, model-level entitlements, and spend alerts for Claude Enterprise. As Claude takes on increasingly difficult and complex agentic work across the organization, usage and cost patterns look different from a standard chat tool. These controls give admins the visibility to understand how Claude is being used and the tools to manage costs.
Today's additions build on controls Anthropic already provides: spend caps at every level, access and model routing, a usage analytics dashboard with exports and an Analytics API, and effort controls. Richer analytics and more granular cost controls are the newest additions to a control surface we've been building on for months.
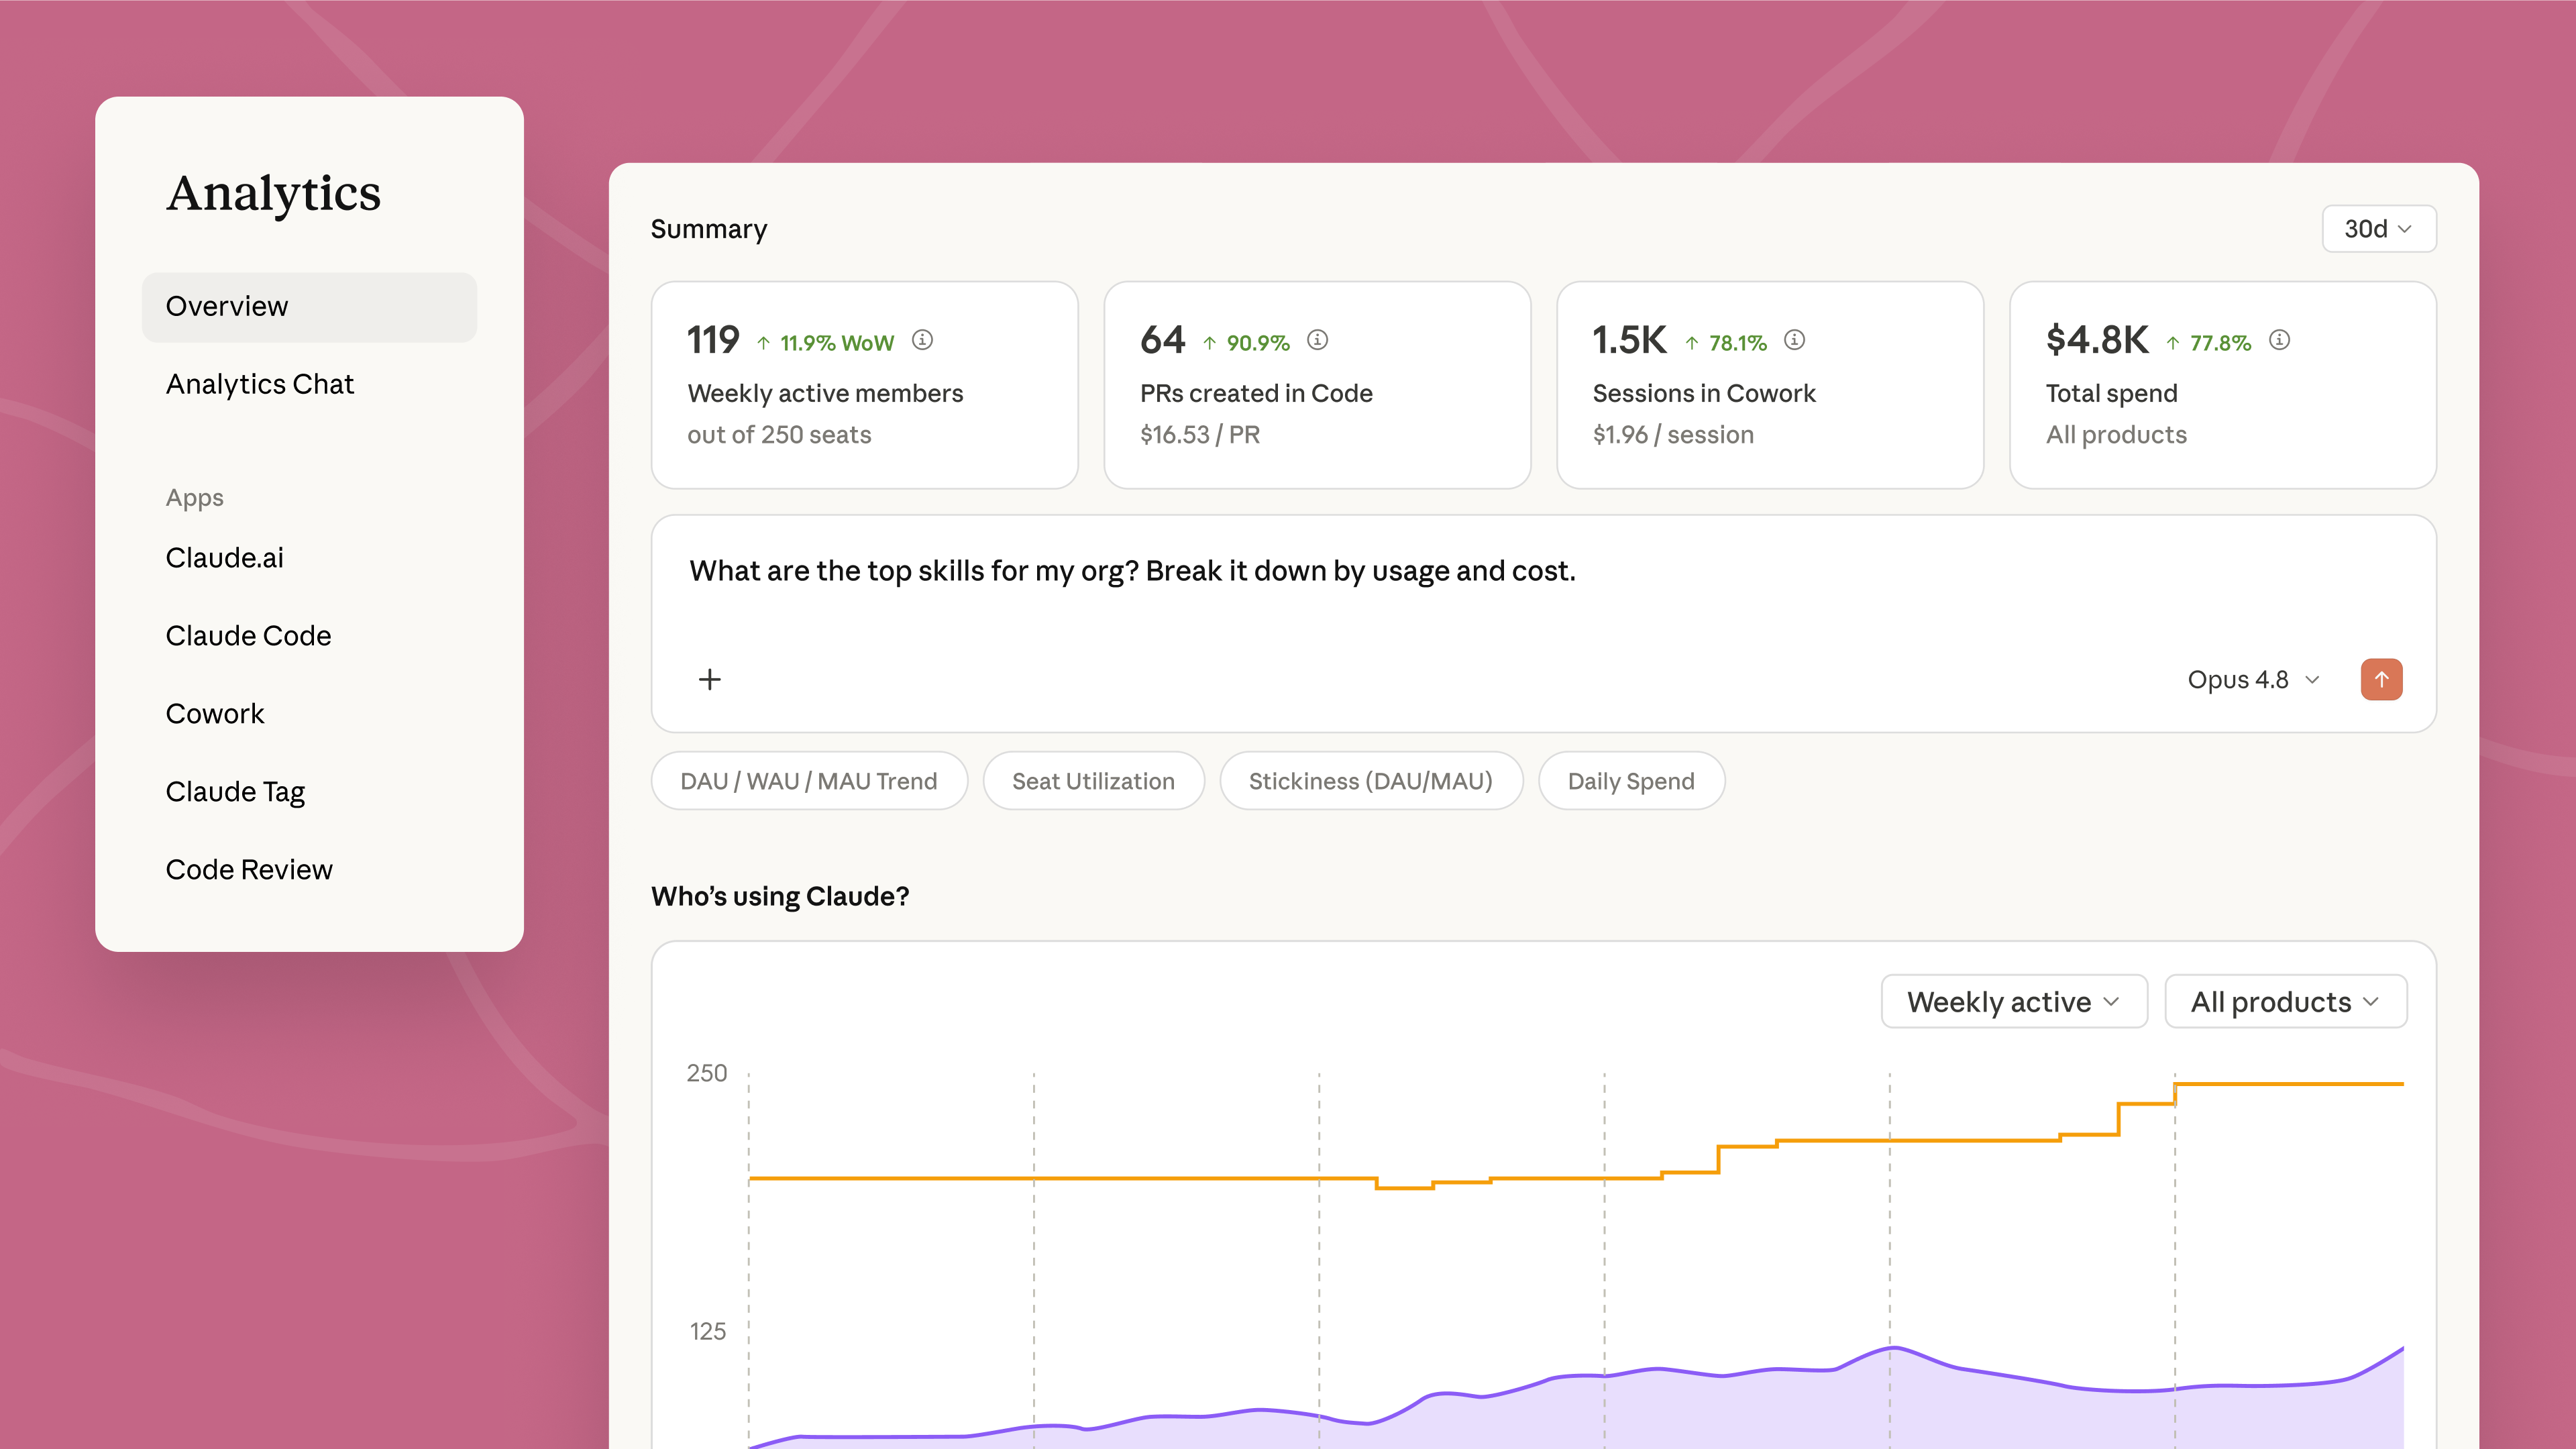
The analytics dashboard for admins now shows usage and cost by group and by user, with output like artifacts created, files edited, skills and connectors used displayed directly next to their cost. Admins can filter by the SCIM groups their IT team already manages, so the breakdown follows their existing org chart.
Claude Code gets richer insights with two new tabs focused on value and usage inside the admin console. Usage shows active developers, session counts, and top commands across the org, and is updated daily. The value tab summarizes usage and cost data to help admins understand value of Claude Code at a glance, estimating productivity lift, cost per commit, and annual value. Every formula is visible in the tab, and the inputs are adjustable.
Analytics chat can now answer a much broader set of questions and produce richer artifacts that you can dive deeper into. Admins can ask questions in plain language — "Which teams doubled their Claude usage this month?" or "Where are we getting the most value per seat?" — and Claude returns charts that can be exported and shared with stakeholders.
Usage and cost data is available programmatically through the Analytics API, so finance and IT can bring Claude usage and cost data into the tools they already run — like Datadog Cloud Cost Management and CloudZero — and see it alongside the rest of their cloud and AI spend. Results can be filtered by date range, team, product, or model. Skills report their own usage and cost, and new endpoints track plugin adoption and artifact creation.
Admins can extend usage visibility to individual users — cost, product and model breakdowns, and progress against spend limits — so no one hits a surprise cutoff. Users can also see their own usage trends over time, including which products, models, and skills they rely on most, and how that activity adds up in spend.
Model defaults and entitlements let admins set which Claude model new conversations start with across chat, Cowork, and Claude Code so routine work doesn't necessarily default to the most expensive option. Admins control which models are available to specific roles or across the entire organization.
Spend-threshold alerts notify admins at 75% and 90% of an org-level spend limit, giving them time to raise the cap before anyone gets blocked mid-task. Users receive in-app notifications at 75% and 95% thresholds and can request a limit increase directly from their admin without leaving Claude.
For organizations managing limits across many groups, the Admin API moves cost-control workflows into scripts so controls scale with the org. Automate increase-request reviews, identify members close to their spend limit, and flag rapidly changing usage all at scale.


"Cost visibility isn't a once-a-month exercise. Granular spend data and alerts give teams regular nudges to reassess how they're using Claude, instead of a surprise at the end of the billing cycle. With the Analytics API, we can bring that data into the tools we already use every day."


“I'm not going to slow down the people driving our best quarter, and my CFO isn't asking me to. He's asking for ROI. We've tied Claude, connected to our enterprise MCP servers, to a 4% revenue lift, and seeing cost next to business impact by team is how I make that case stick.”


"Token usage alone doesn't tell you much. What I actually want to see is which skills get run again and again across the org — that's the real signal of value."

For admins managing Claude across their organization: explore usage and cost breakdowns in the admin console, set model defaults and spend limits by group, and configure spend-threshold alerts to stay ahead of overages. Usage data is available in the admin dashboard, and the Analytics API lets finance and IT pull the same metrics into existing reporting systems, learn more here.
Get the developer newsletter
Product updates, how-tos, community spotlights, and more. Delivered monthly to your inbox.


