Observability for developers building connectors
Developers can now monitor their connectors' performance across Claude products and submit connectors to the directory in-app.
Monitor, debug, and improve connectors
Published connectors in the directory now have a dashboard showing how they’re performing across Claude product surfaces. Connector owners can use it to:
- Track adoption. Monitor active users, total tool calls, and directory rank over time.
- Diagnose errors and latency. See health score, error rates, and latency at a glance, with per-tool error breakdowns to pinpoint what's failing.
- Break down usage by product. Compare tool calls across Claude, Claude Code, Cowork, and more to understand where users are engaging.
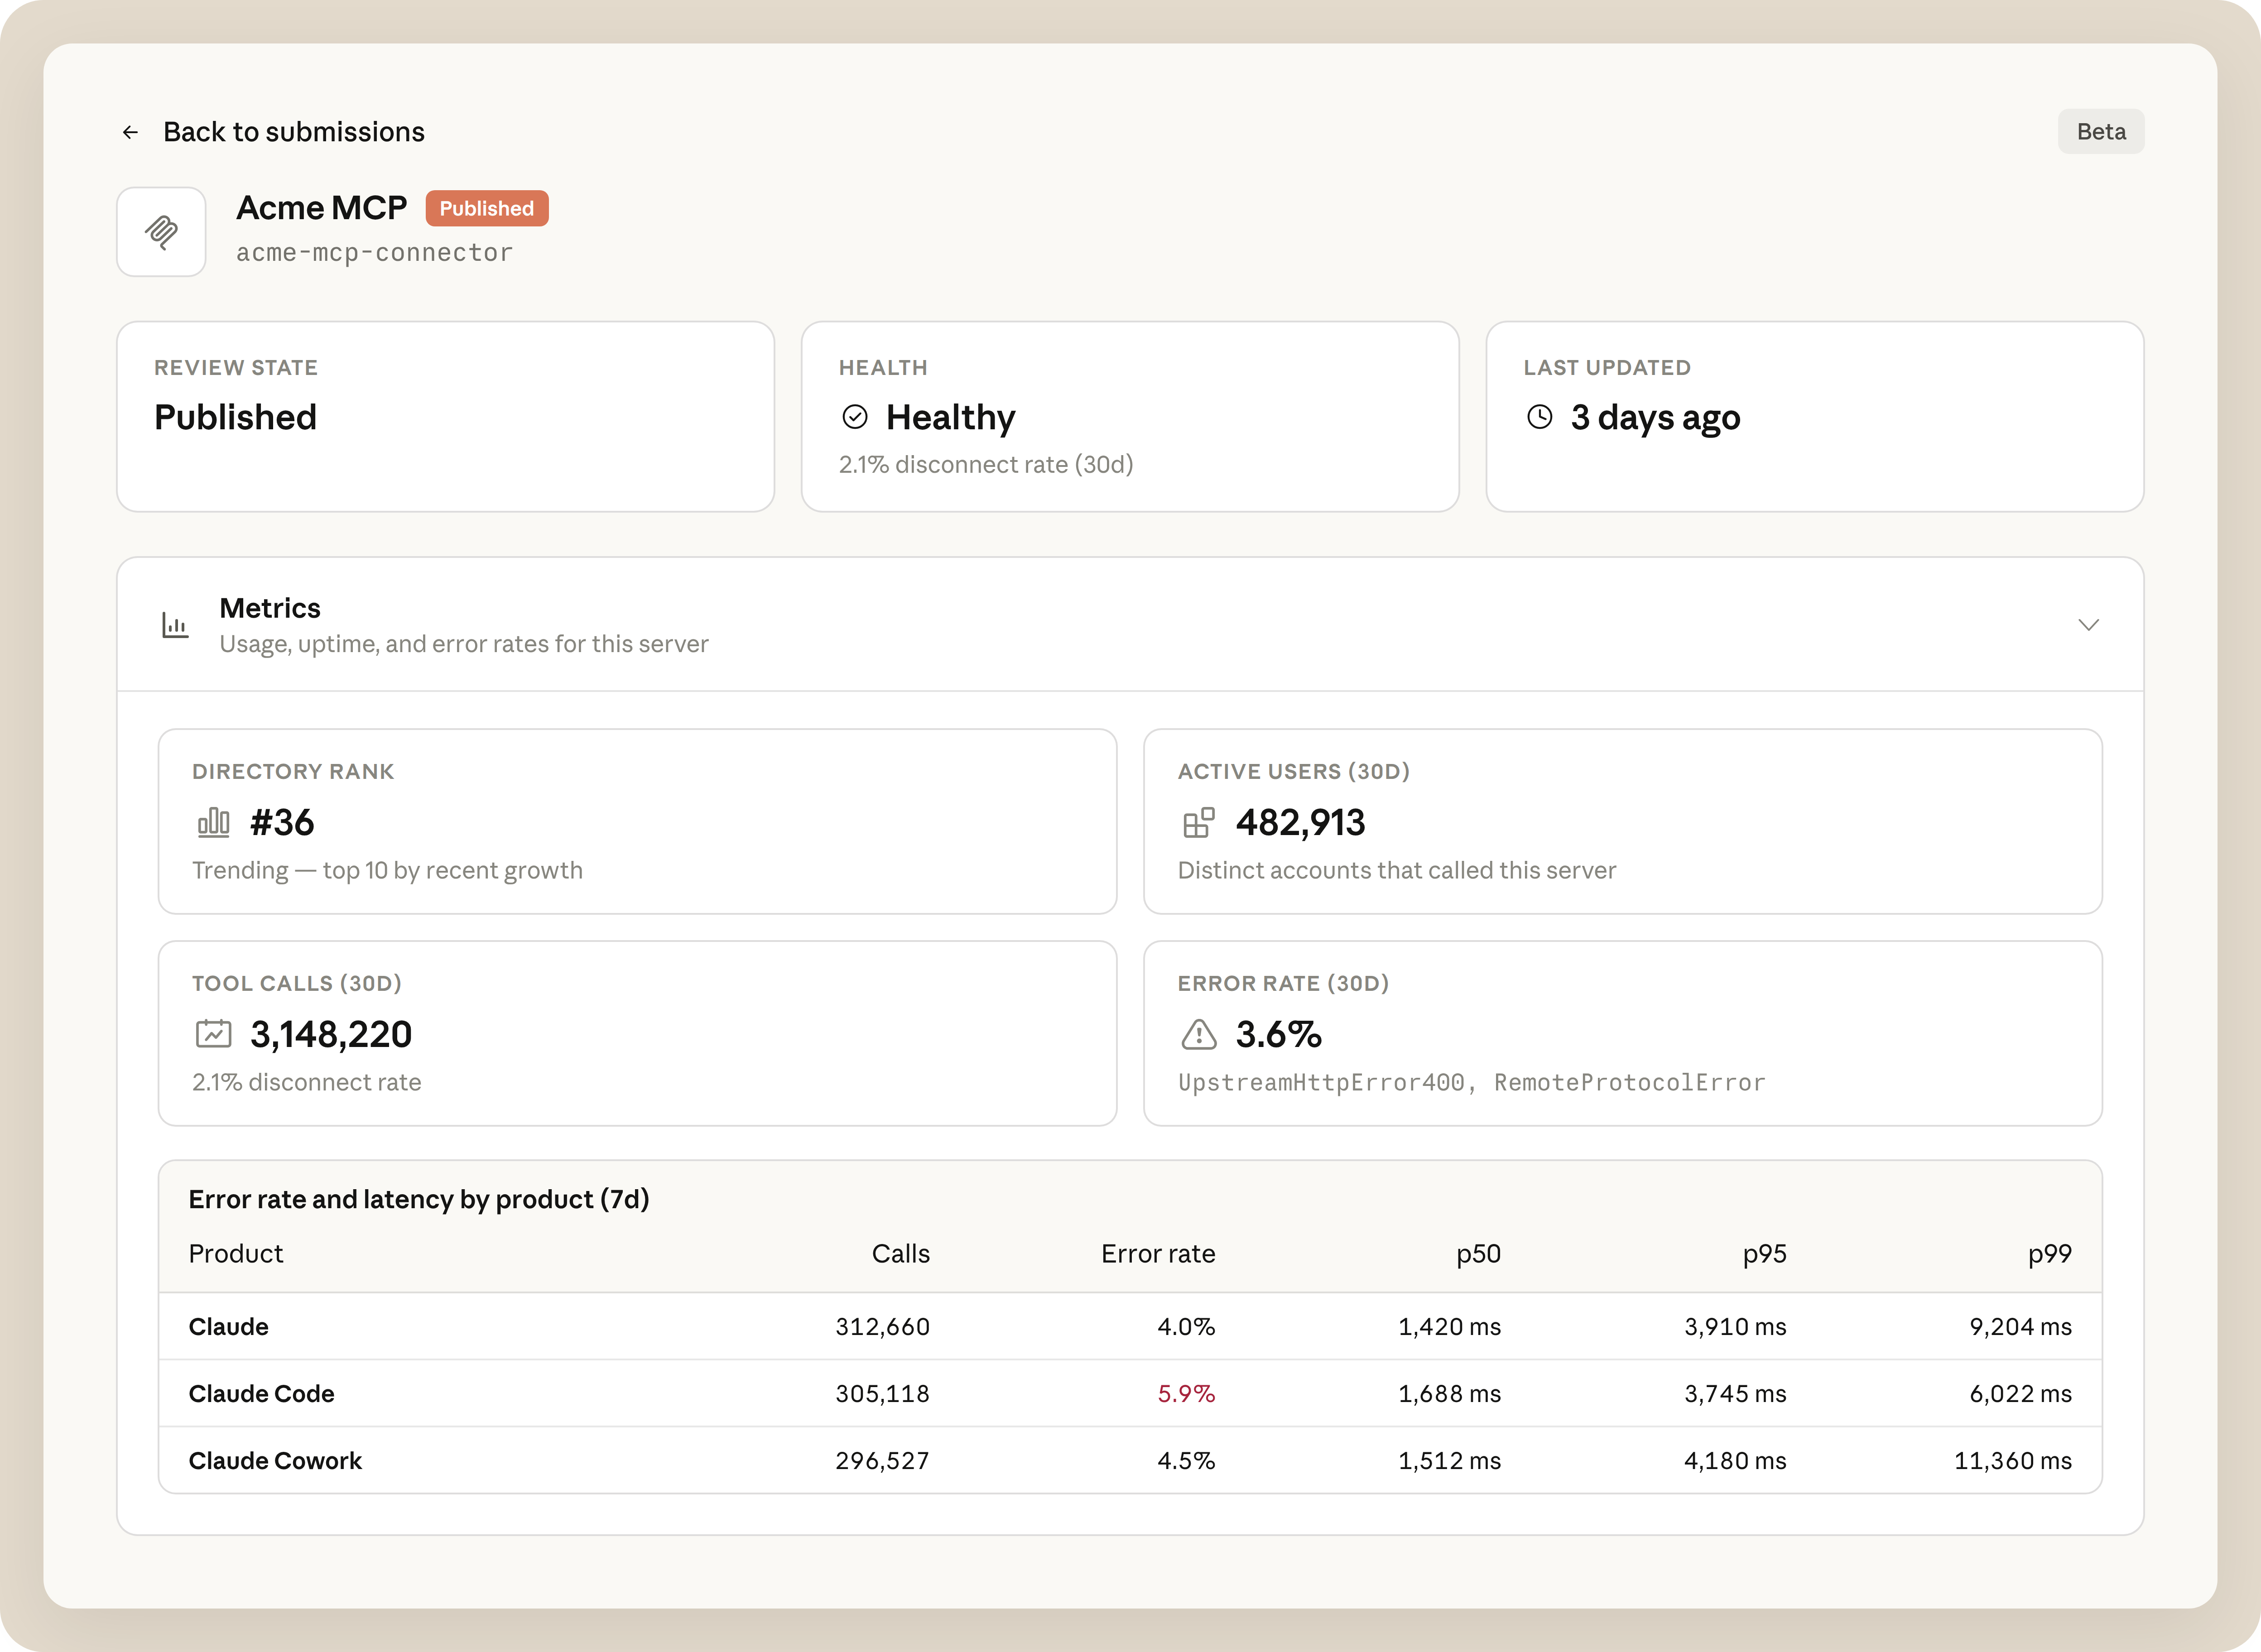
Available today in public beta. Find it in Claude under Directory in Organization settings. Requires Admin or Owner access on a Team or Enterprise plan. On Enterprise, Owners can also delegate access with a custom role that has the Directory management or Libraries permission.
Joining the directory
Connectors are built on the Model Context Protocol (MCP). There are over 300 third-party connectors in the directory, used by millions of people every day. If you wish to submit your MCP server to the directory, you can now do so directly in Claude. Learn more.