Agent observability on the Claude Platform
Announcing OpenTelemetry traces from Claude Managed Agents, the Messages API, and Claude SDKs on the Claude Platform.
You can now send OpenTelemetry (OTel) traces from Claude Managed Agents, the Messages API, and Claude SDKs to any OTel tool, and follow each step your agents take. If you already send Claude Code or Cowork traces to your observability tool, the agents you build on the Claude Platform can also show up in the same place.
Trace agents with OpenTelemetry
Trusting an agent with more access starts with tracing its model calls, tool use, and MCP server calls. Review its traces, then widen its access as it proves reliable.
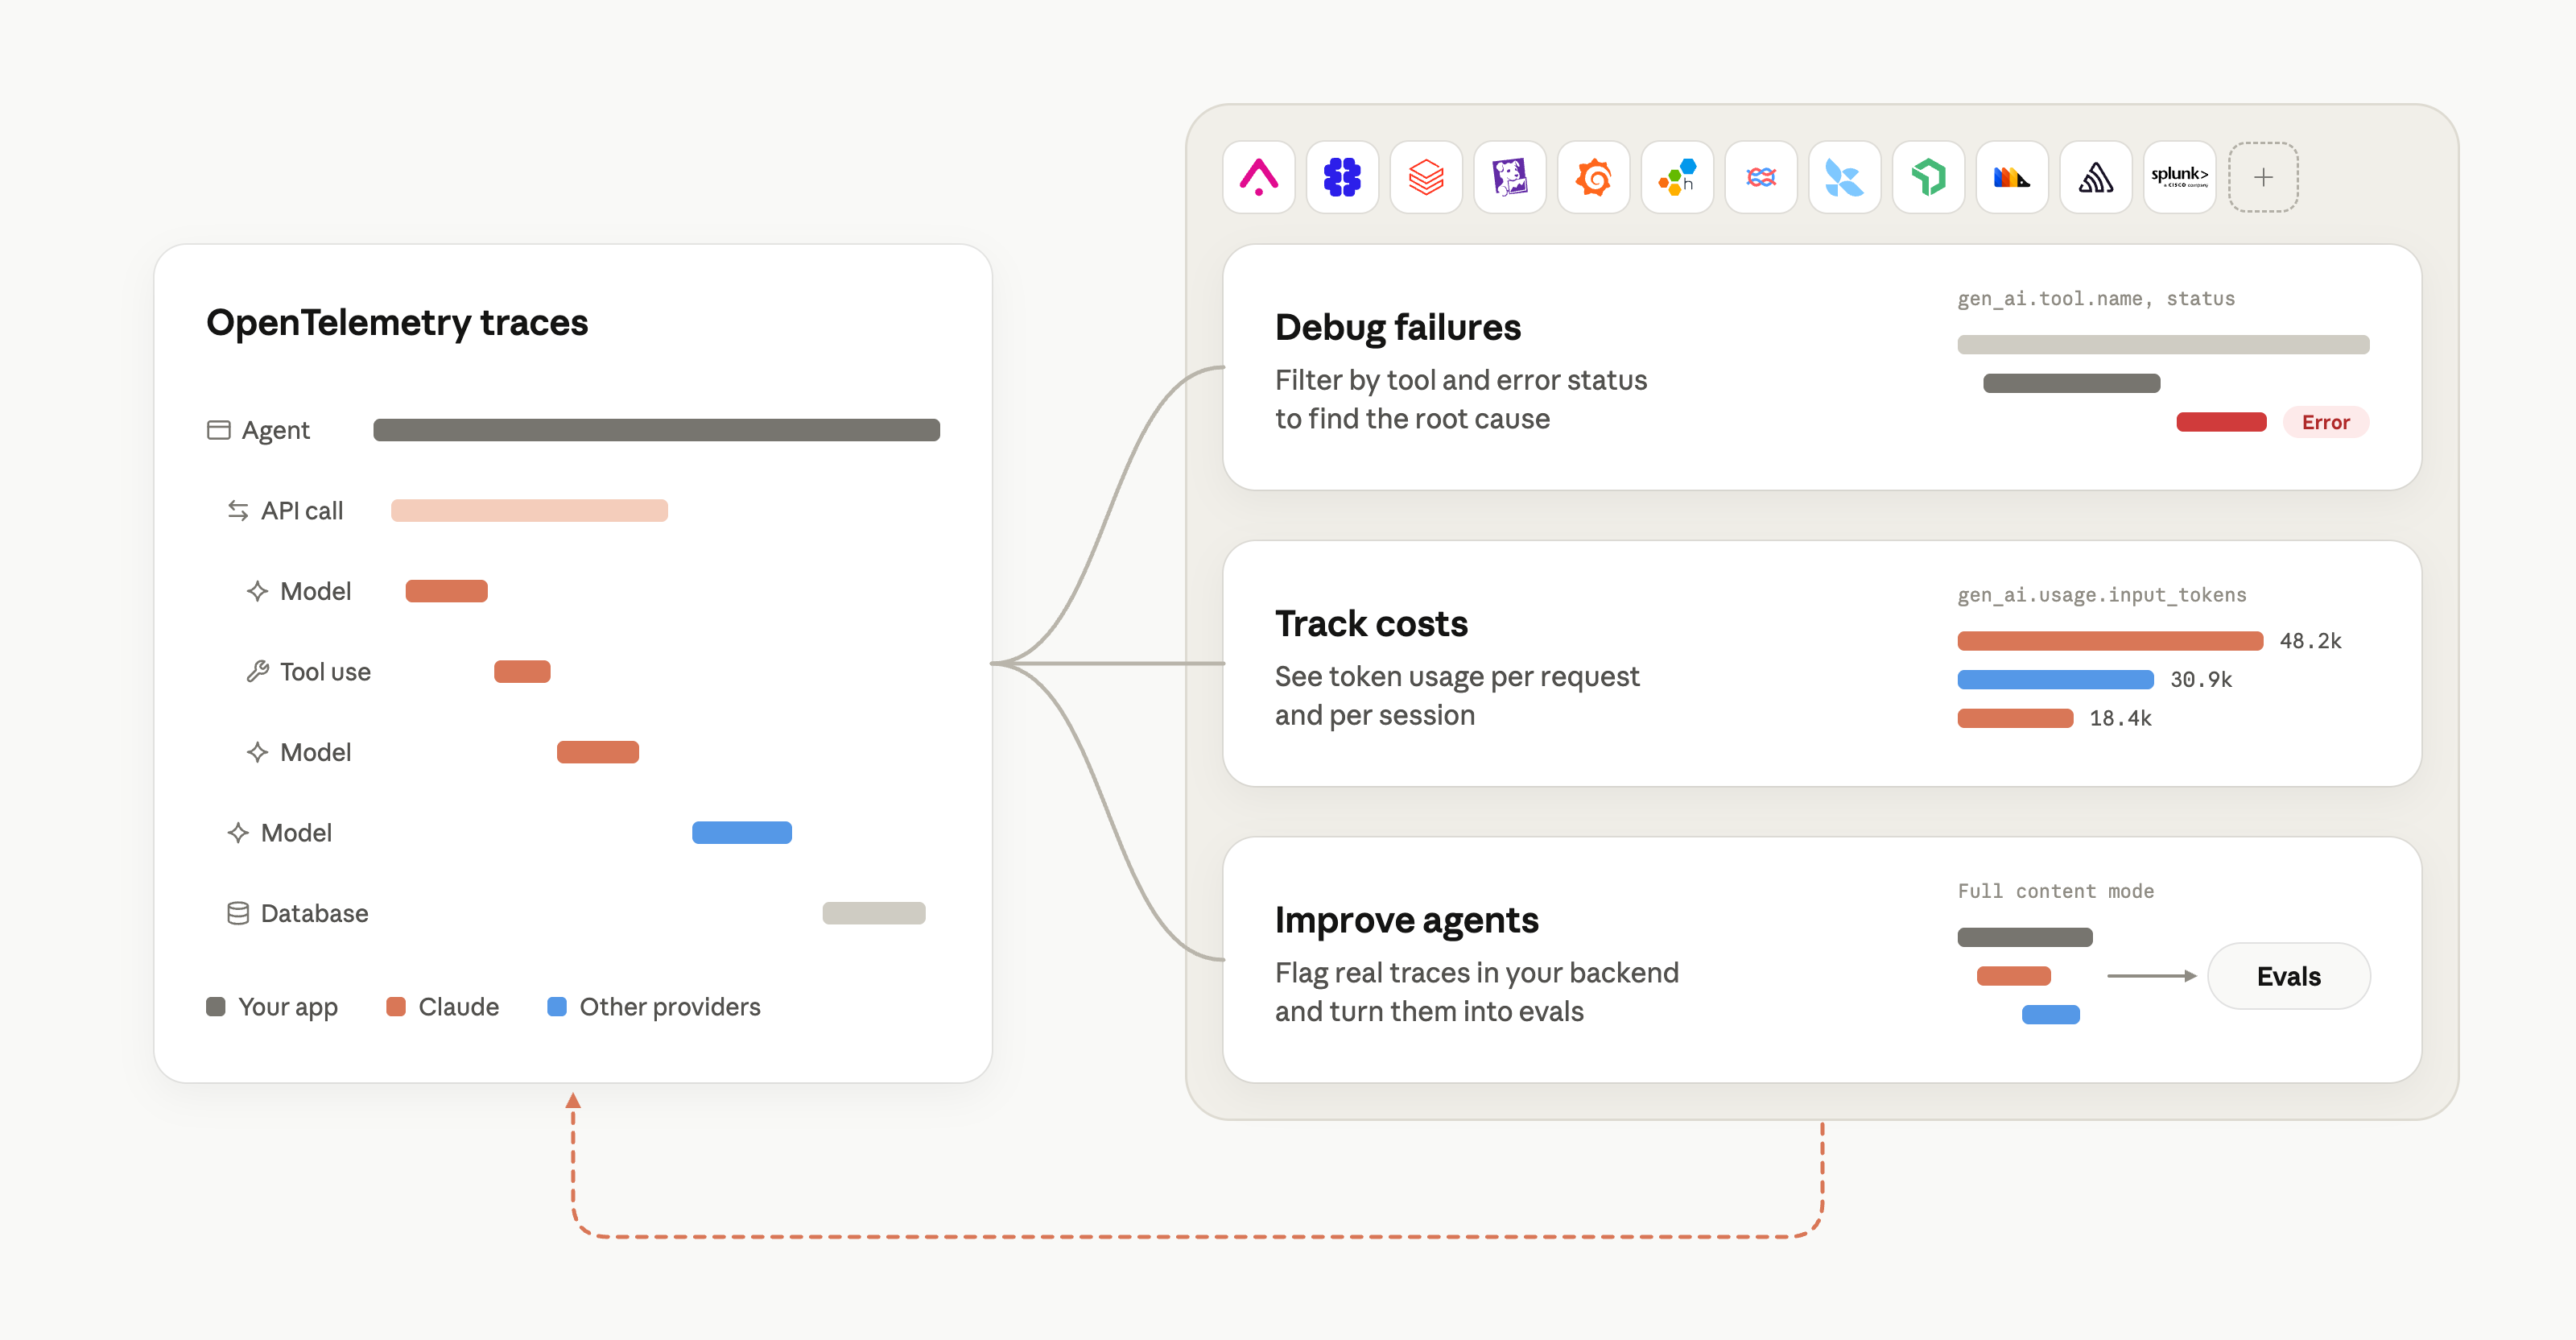
Add a destination in the Claude Console, and every agent turn, model call, and tool use arrives in your observability tool as a standard OpenTelemetry trace, with latency, tokens, and IDs.
Works with your observability tools
Claude traces follow the OpenTelemetry GenAI semantic conventions, so data from Claude and other providers works in the same tools and dashboards.
- Debug agents next to the rest of your stack. In Grafana Cloud, Honeycomb, Sentry, and Splunk, agent traces sit beside your logs and metrics, so you can see which service a slow or failed step came from.
- Improve agents with production data. With Arize AI, Braintrust, Datadog, Langfuse, LangSmith by LangChain, New Relic, and PostHog, you can turn real traces into evals, catch quality issues, and measure whether a change helped.
- Track usage across your organization. Send traces to Databricks Unity Gateway so platform and security teams can see token usage by team and flag unusual activity.
Claude traces also work with any other OpenTelemetry tool that accepts a standard OTLP endpoint.
Get started
OpenTelemetry traces on the Claude Platform is available in public beta. Managed Agents and the Messages API need a destination in the Claude Console, while Claude SDKs export traces automatically.
See the docs to get started.

“Agents that touch a company’s books have to show their work, the same way an accountant does. Our agents run on the Claude Platform and our telemetry lives in Grafana Cloud, and native OpenTelemetry export from Claude puts each model call in the same trace as the reconciliation or journal-entry workflow it ran inside. We see the prompt version, tool calls, latency, and token spend alongside the rest of our stack, so when an auditor asks what an agent did and why, we can answer from one timeline.”

“At Foxglove, we’re building agents that help robotics teams debug their robots. Native OpenTelemetry export from the Claude Platform lets us analyze agent interactions in PostHog alongside product usage data. That helps us evaluate how our agents perform in practice, identify where they fall short, and prioritize improvements for robotics teams.”

“Claude powers some of Ramp’s most capable internal and customer-facing agents. We built Reflect, an agentic system that scores their Langfuse traces, finds recurring failures, and proposes fixes. On some agents, we’ve already cut token usage by 10–20% and made sessions 30% faster. But Reflect can only improve what it observes. Native OpenTelemetry export from the Claude API can feed high-fidelity instrumentation directly into that improvement loop, with no extra steps.”

“At Sterling Labs, we tune our systems like a race team tunes its engine. For agents analyzing live markets 24/7, Langfuse is our pit wall. Native OpenTelemetry export from the Claude Platform streams every trace straight in with no custom instrumentation, so my team can focus on the edge, not the wiring.”