Source insights from your tools to build a deck
Claude Opus 4.6 chases leads across scattered sources, surfaces what no single source shows on its own, and builds a presentation around the through-line.
Opus 4.6 follows leads across your connected tools without needing direction at each step. Give it a starting point and it pulls search terms from what it finds, follows people to their updates, follows updates to the data they reference, and reconciles sources that disagree. By the time it builds the deck, it's working from evidence it gathered and cross-referenced itself.
Once the deck exists, Claude in PowerPoint lets you keep refining directly in your slides — restructuring sections, adjusting talking points, or adding charts.
I’m prepping for board meeting Friday. Q3 was the quarter where everything happened at once: we shipped the platform consolidation, closed the Apex partnership, and lost two enterprise accounts.
Start with the Q3 project tracker in my local files — it has the key people, channels, and documents. Follow each person across their channels, emails, and documents they reference. When you find data, check it against other sources — the revenue numbers probably don’t agree. Figure out which is current.
The board needs to understand whether the consolidation bet is paying off despite the churn. Create a PowerPoint deck (12–15 slides) with speaker notes, an Excel data appendix, and a two-page Word brief. Make an argument, not a summary.
Through Cowork in Claude Desktop [Research Preview], connect your local files and tools. Point Claude at a Slack channel, a Drive folder, or an email thread to give it a starting point.
Connect Slack and Google Drive through connectors. Claude in Chrome [beta] grabs current data from live dashboards.
Extended Thinking lets Opus 4.6 scale its reasoning to match the complexity of the task — more sources and more conflicting data means deeper thinking before it starts building.


Opus 4.6 works outward from the starting point you give it, pulls context from each source it finds, and saves three files locally: a presentation with narrative structure, a supporting data appendix, and an executive pre-read. If Claude in Chrome is connected, Claude opens relevant pages in new browser tabs to pull live data from dashboards and analytics platforms directly.
Here’s what I found and how I pieced it together:
I started in #platform-consolidation on Slack. The kickoff thread from July identified the core team: @maria (engineering), @james (partnerships), and @priya (customer success). From there:
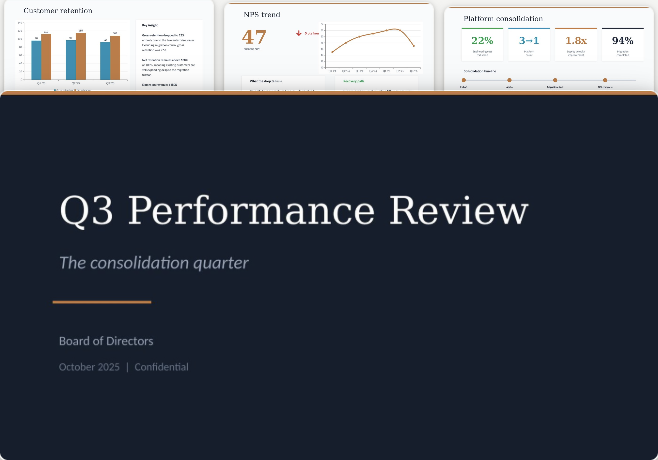
The quarter’s argument in one sentence: The platform consolidation cut engineering costs 22% and landed the Apex partnership, but migration friction cost you two enterprise accounts — and the retention data shows that’s a fixable execution problem, not a product problem.
I’ve saved three files:
Static slides work in the room. An interactive version lets board members explore the data on their own time.
Take the board deck and build an interactive HTML briefing I can share as a link. Each section should have the narrative up top with expandable charts underneath — let them click into the revenue reconciliation, the NPS trend, the churn timeline. Make the Apex partnership economics explorable so they can adjust assumptions.
Opus 4.6 already knows the quarter’s full context. Use that to draft targeted pre-reads before the meeting.
Draft a Slack message for each board member based on what they’ll care about most. The CFO gets the revenue reconciliation and Apex economics. The product lead gets the consolidation impact and engineering velocity. The customer advocate gets the churn story and the NPS data. Personalize each one — don’t just cut the same deck three ways.
The hardest board questions come from the data you glossed over. Opus 4.6 has read every source and knows where the weak points are.
You’ve seen all the raw data. Play devil’s advocate — what are the three toughest questions the board could ask about this quarter, and where is our narrative weakest? Then update the speaker notes with how to handle each one, citing specific data points from the appendix.
Opus 4.6 can pull search terms from what it reads, so a document that names people, channels, and files gives it more threads to follow across your tools. A project tracker or kickoff doc works well. Once you have the tools you'd like Claude to access, tell it to work outward: "Follow each person across their channels, emails, and documents they reference. Check data against other sources." Paired with Cowork, it sustains that work across as many steps as the task requires.
Once Claude has finished the task, the output files save to your working folder through Cowork. Open the deck in PowerPoint and use Claude in PowerPoint to make pinpoint edits, restructure slides, or add charts. Ask Claude to update the appendix or brief to match.
If your team builds quarterly decks with a consistent structure, you can package that process as a Cowork plugin. A plugin teaches Claude your specific framework: which sources to check, which metrics the board expects, how to structure the argument, and what format the deliverables should follow.
Cross-source research and deck building runs across many steps. Open a new session from the sidebar for other work. You'll see a grey dot in the sidebar when this one needs attention.