
Observability for developers building connectors
Developers can now monitor their connectors' performance across Claude products and submit connectors to the directory in-app.
Developers can now monitor their connectors' performance across Claude products and submit connectors to the directory in-app.
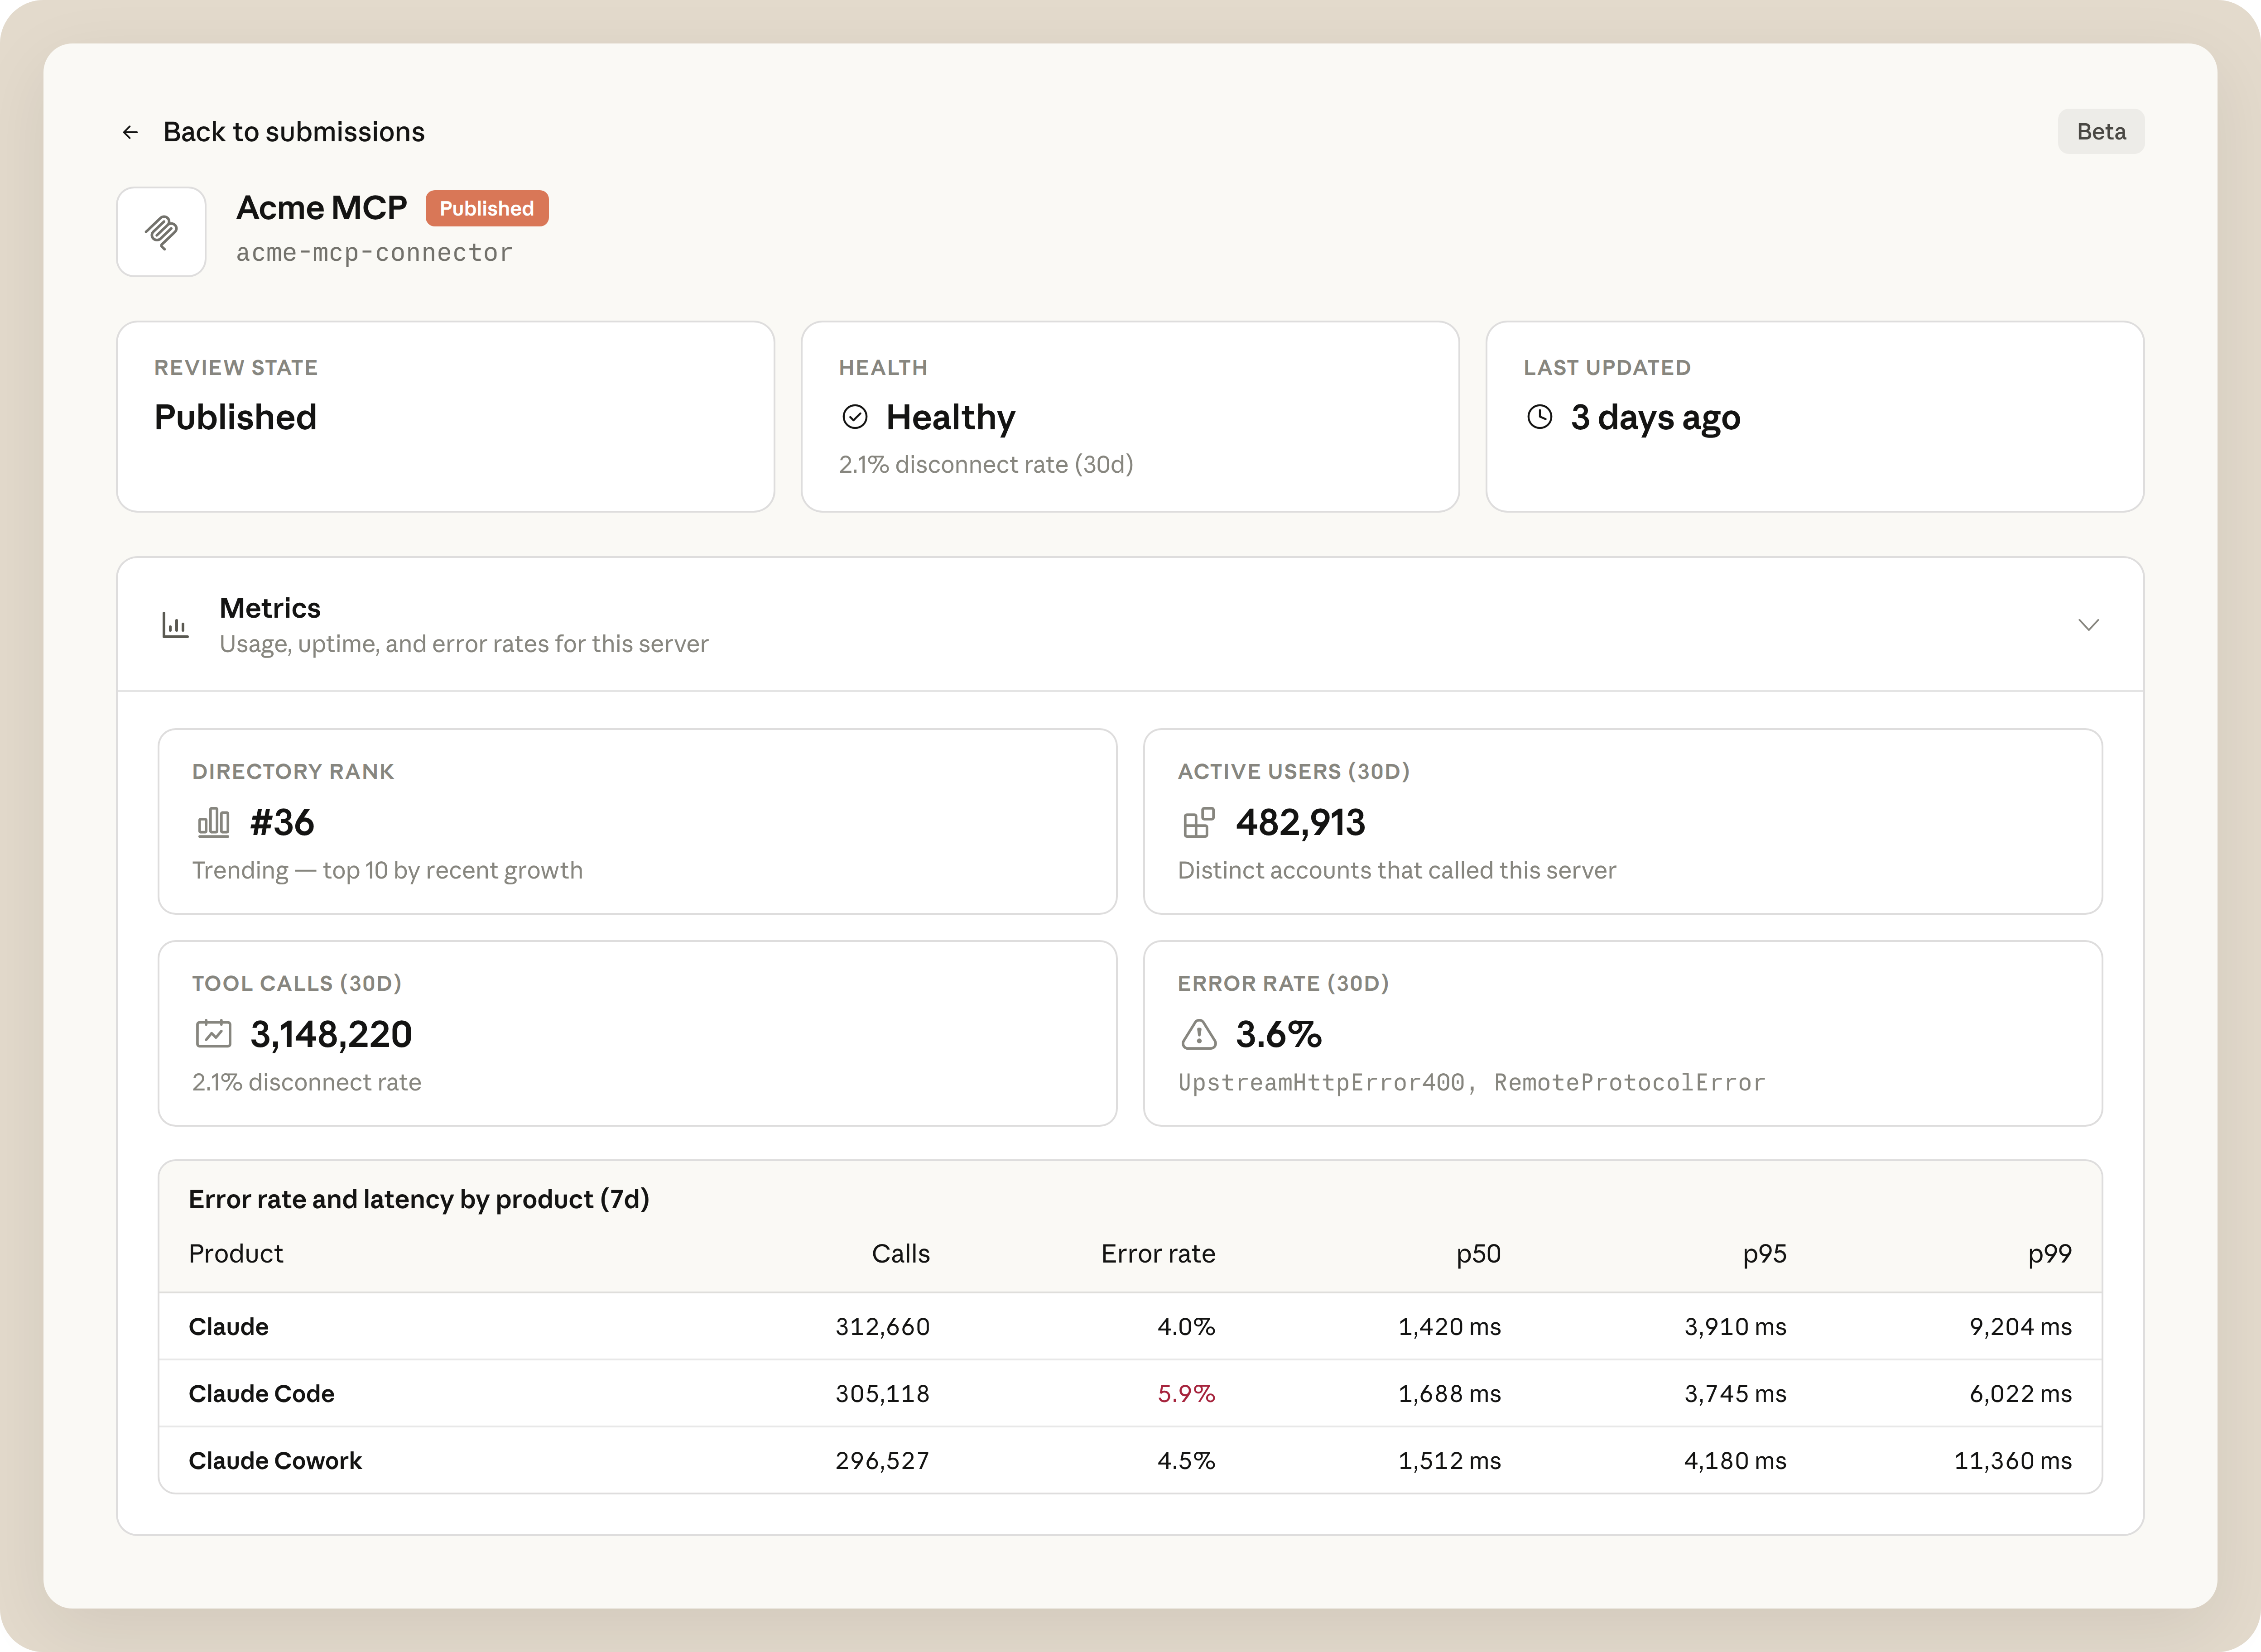
Published connectors in the directory now have a dashboard showing how they’re performing across Claude product surfaces. Connector owners can use it to:
Available today in public beta. Find it in Claude under Directory in Organization settings. Requires Admin or Owner access on a Team or Enterprise plan. On Enterprise, Owners can also delegate access with a custom role that has the Directory management or Libraries permission.
Connectors are built on the Model Context Protocol (MCP). There are over 300 third-party connectors in the directory, used by millions of people every day. If you wish to submit your MCP server to the directory, you can now do so directly in Claude. Learn more.

開発者向けニュースレターを入手
製品の最新情報、操作方法、コミュニティスポットライトなどを掲載しています。毎月受信トレイに配信されます。