How to use Claude in Excel for HR: Headcount planning
Use Claude to understand inherited spreadsheets, fix formula errors, and run what-if scenarios
Claude in Excel brings Claude directly into your spreadsheet workflow. It appears as a sidebar that can read your entire workbook—every tab, every formula, every relationship between cells—and help you understand, fix, and extend what's there.
This tutorial walks through an HR headcount planning model: four tabs, formulas linking everywhere, and errors that need fixing. You'll see how to use plain language to get Claude to map a workbook you've inherited, trace and fix formula errors, run what-if scenarios, and build new calculations that reference data across sheets.
Understand workbooks you didn't build
Ask Claude to explain how tabs connect. It reads everything first, then maps the data flow—which cells feed into which sheets, where assumptions live, how totals roll up.
Find and fix formula errors
Claude catches broken references and traces where they cascade. Instead of hunting through tabs, you see every affected cell at once—and choose how to fix it.
Run scenarios instantly
Change an assumption and see the impact across departments, totals, and downstream calculations. Claude recalculates and summarizes what shifted.
Build formulas with business logic
Describe what you want calculated. Claude writes formulas that reference the right cells, apply conditional logic based on job levels or departments, and stay connected to your assumptions—not static values you'd have to update manually.
Create visualizations from plain language
Ask for a pivot table or chart. Claude builds it from your data and tells you what stands out.
Follow along with the video, or copy these prompts to try in your own workbook.
The spreadsheet has four tabs—Assumptions, Headcount, Compensation, Summary—with formulas linking everywhere. Ask Claude to explain how it all connects before you start making changes.
"Walk me through this workbook—what's on each tab and how do they connect?"
Claude reads all four sheets, then returns a visual diagram showing how data flows from Assumptions through to Summary. It also catches #REF! errors you didn't ask about—and maps every cell they affect across three sheets.
A #REF! error is cascading through the model. Claude traces it to a deleted cell reference, analyzes the pattern in nearby cells, and figures out what the value should be.
"There's a #REF! error in cell E15 on the Headcount tab. What's causing it and can you fix it?"
Claude doesn't just fix the error—it explains the root cause, shows you the options (0, 1, or a custom value), and lets you decide. You stay in control of what changes.
Change one assumption and see the impact everywhere. Claude updates the model, then returns a before/after comparison by department so you can see which teams are hit hardest.
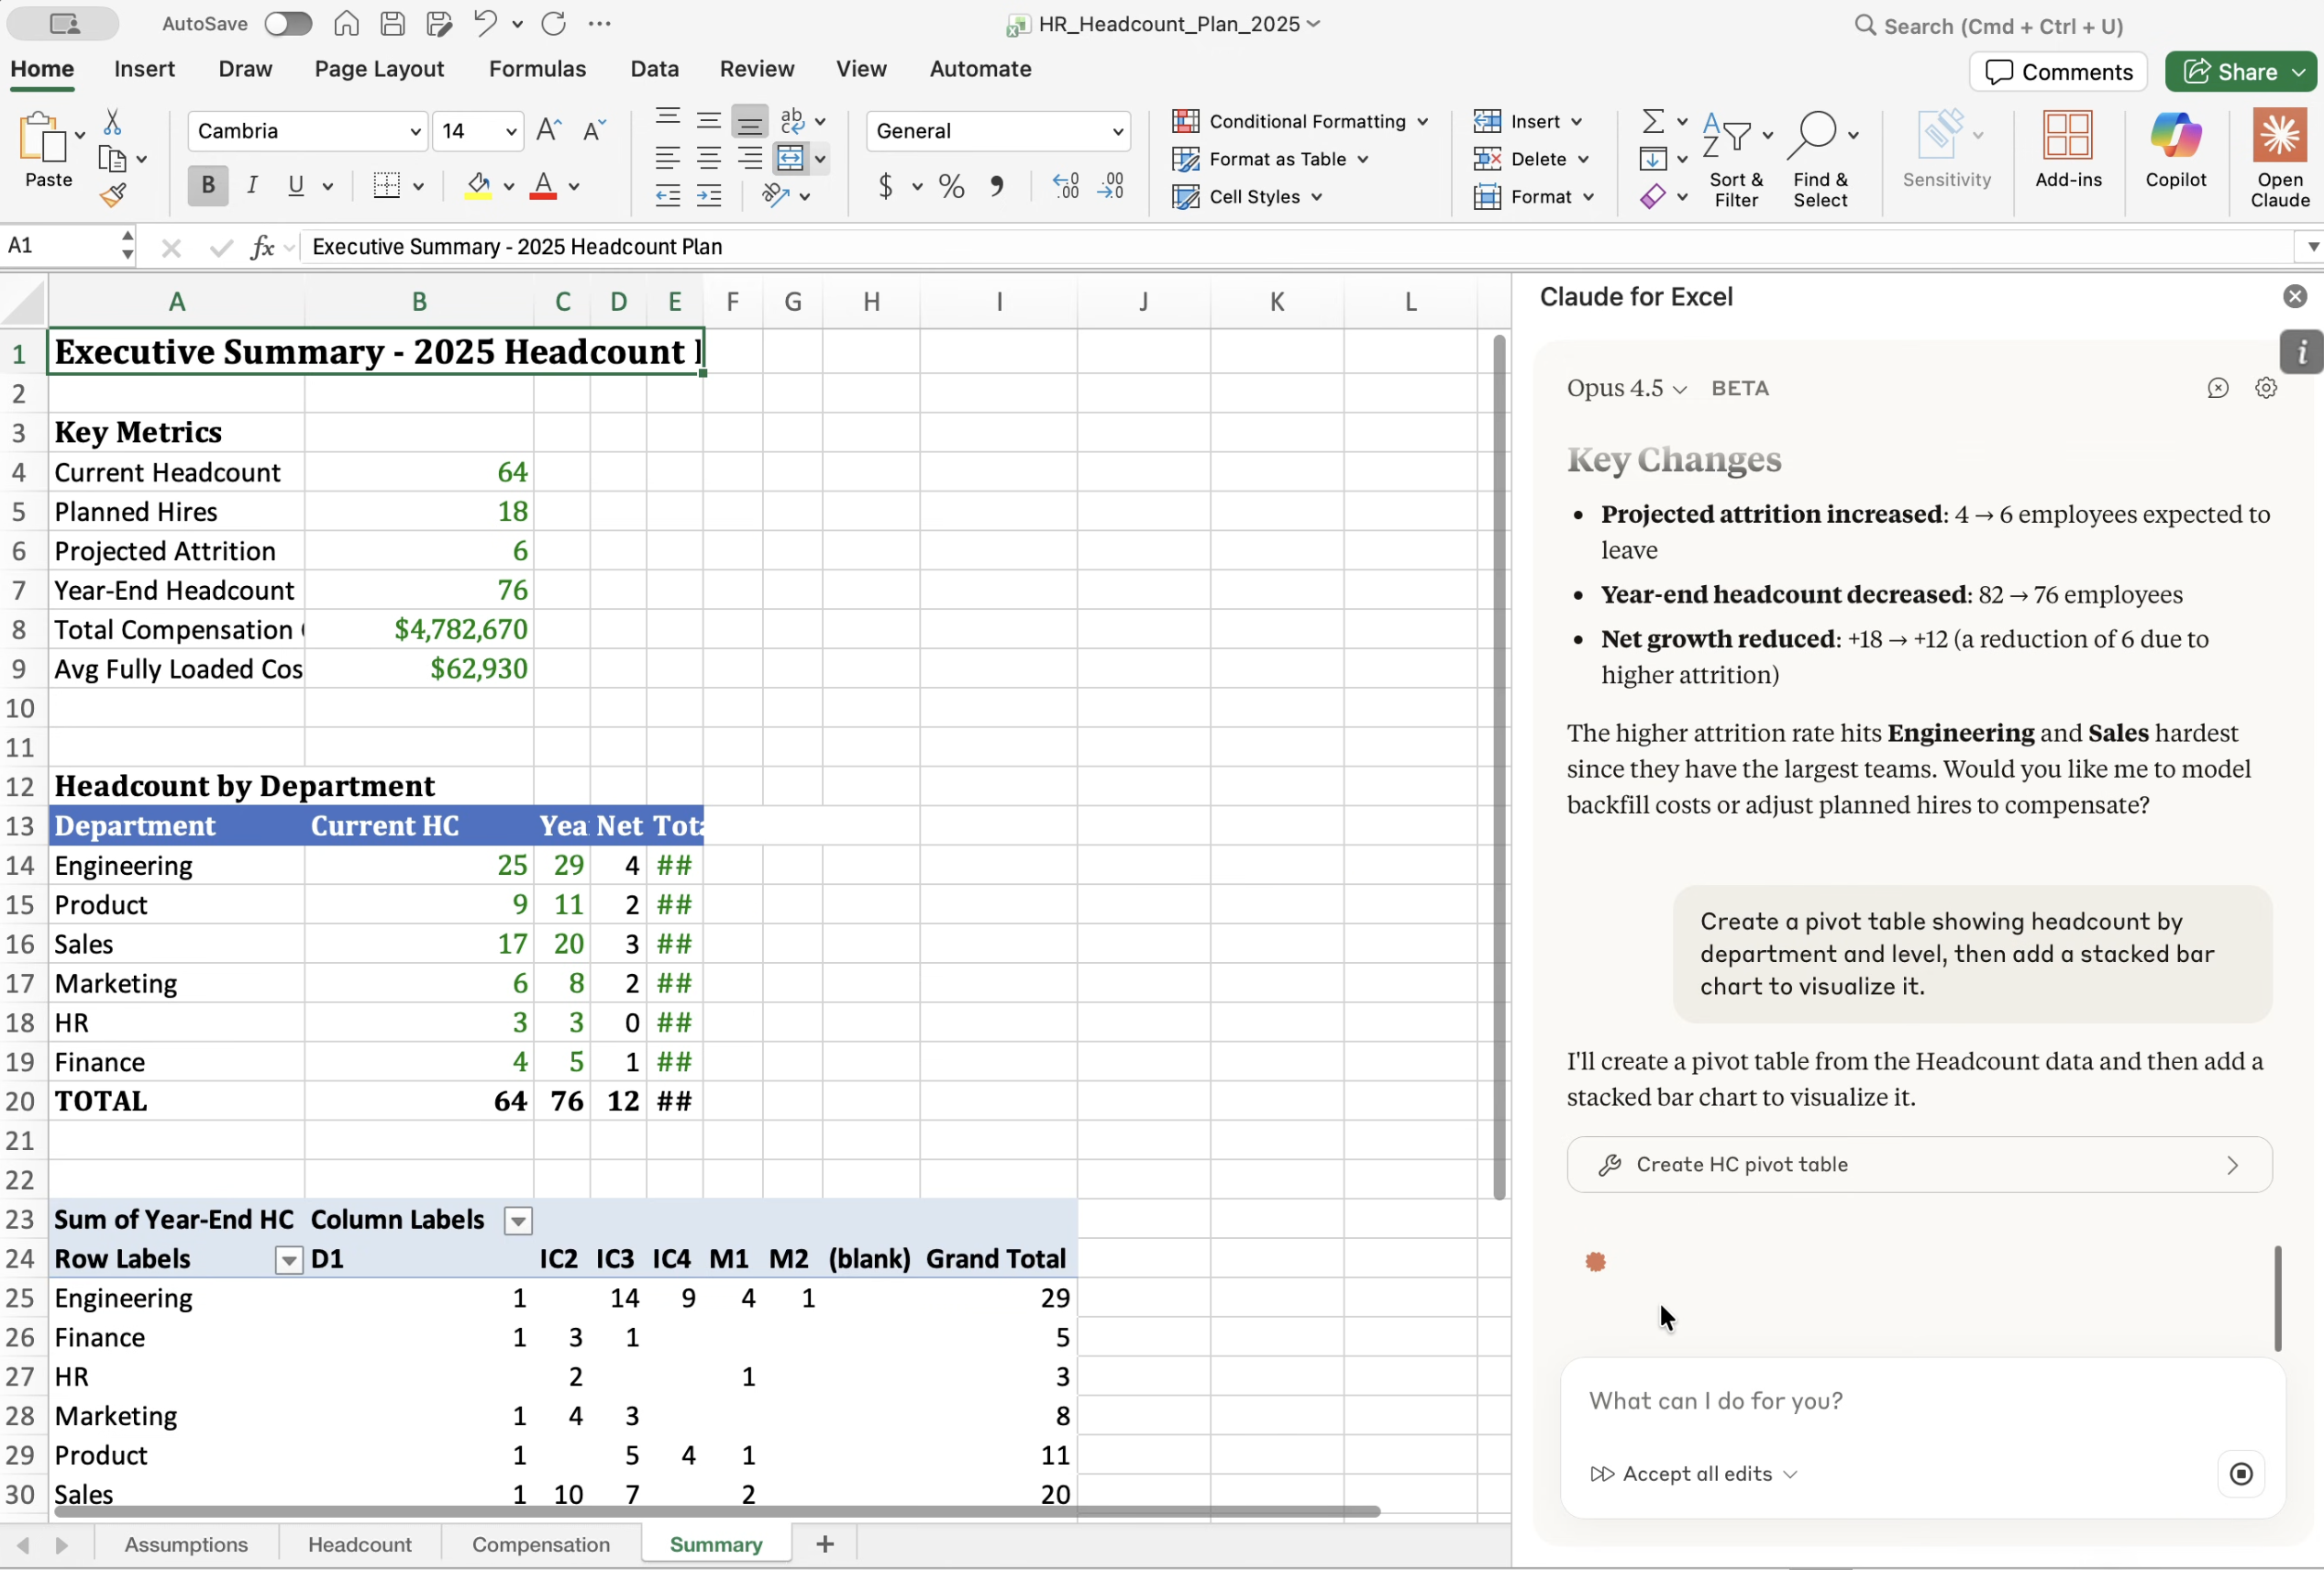
"Update the plan to assume 15% attrition instead of 10%. Show me what changes across departments."
Describe the visualization you need. Claude builds a pivot table from your headcount data, adds a stacked bar chart, and surfaces insights—like which job level has the most people and where they're concentrated.
"Create a pivot table showing headcount by department and level, then add a stacked bar chart to visualize it."
Ask for a new column and Claude writes actual formulas—not static values. Here, it pulls benefit rates from the Assumptions tab and applies different bonus percentages based on job level (10% for ICs, 15% for managers, 20% for directors).
"Add a column that calculates the fully-loaded cost per employee using the rates on the Assumptions tab."
Claude reads before it answers.
When you ask about the workbook, Claude doesn't guess—it reads all four sheets first, then explains how they connect. This prevents errors from incomplete context.
Errors surface with their full impact.
A single broken reference can cascade across multiple sheets. Claude shows you every affected cell so you understand the scope before you fix anything.
Claude values your input
For deeper understanding, ask Claude to explain its reasoning before making changes. You can always request that Claude walk through its thinking, and if something doesn't look right, undo (Cmd+Z or Ctrl+Z) reverses most actions.
Formulas stay formulas.
When Claude builds a new calculated column, it writes actual Excel formulas that reference your Assumptions tab and apply conditional logic. If your assumptions change later, the calculations update automatically.
Claude in Excel is available in beta on Max, Team, and Enterprise plans.
Learn more: