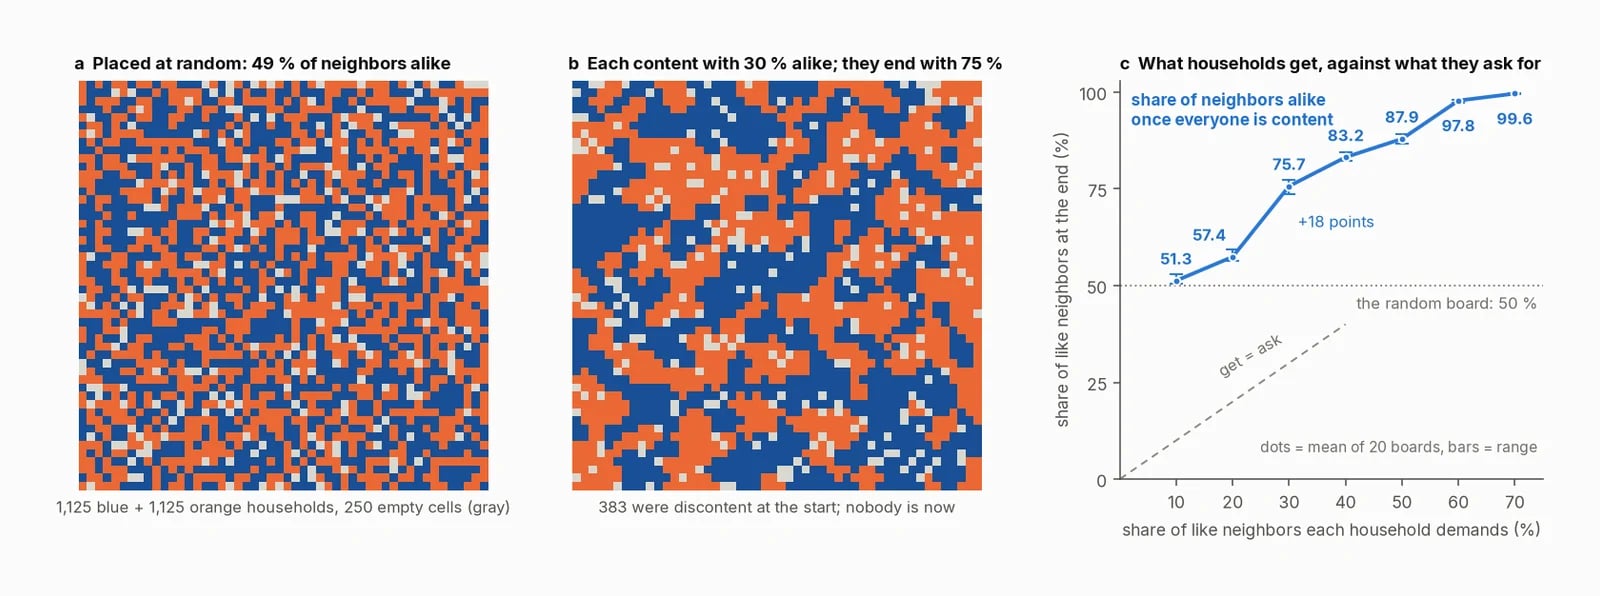
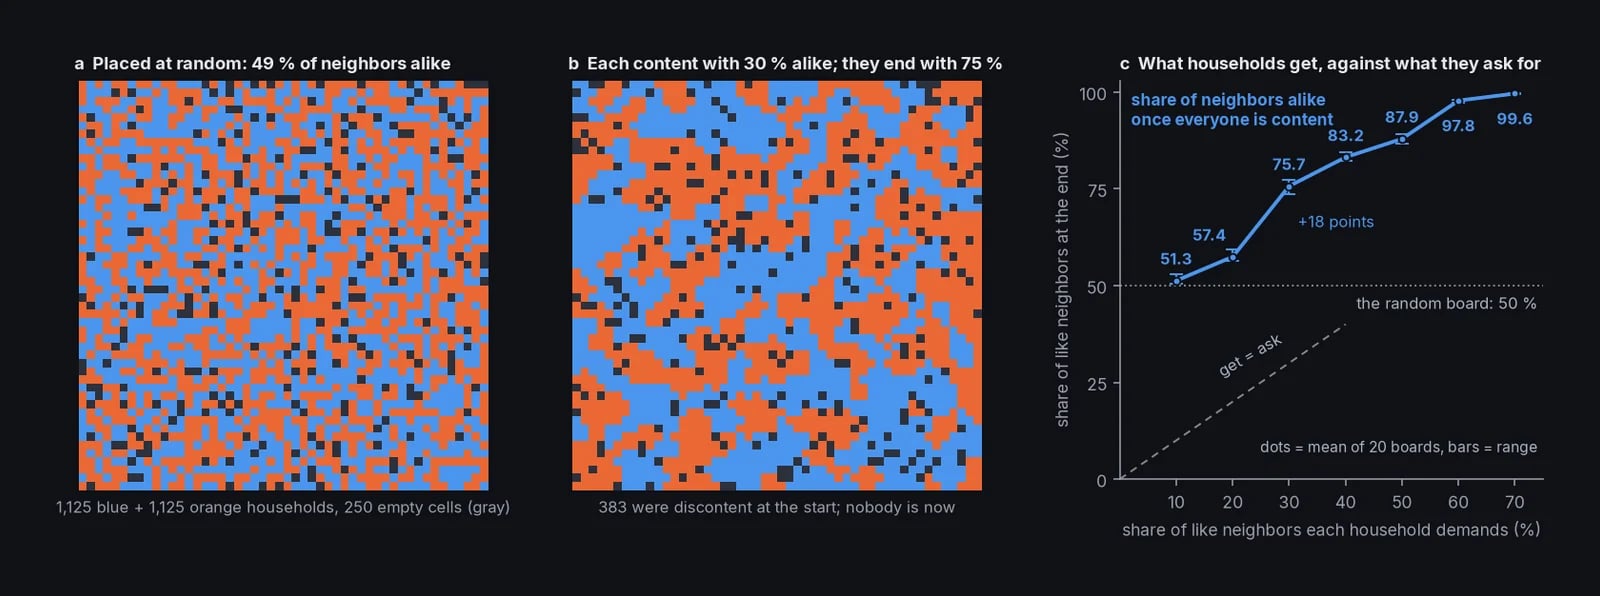
The numbers in your session might differ from this picture and from the summary in Reference analysis.

Prompt

Copy the prompt and paste it into a new session in Claude Science. By default, Claude asks with a permission card before it runs code or installs packages.
Prompt

Reference analysis

Ask for 30% same-color neighbors, end up with about 75%. On a 50 × 50 grid filled at random with 1,125 blue and 1,125 orange households and 250 empty cells (about 50% of neighbors alike), only about 18% of households are discontent. Yet once each discontent one has moved to a random empty cell (roughly 1,000 moves in 10 to 20 rounds), the board is a patchwork of 1-color neighborhoods. Redone for demands of 10% to 70%, 20 random boards each: 10% leaves the random board as it is (51%), 20% lifts it to 57%, 50% gives 88% (about 7 like neighbors for each unlike one), and separation is nearly total from 60% (98% at 60%, 99.6% at 70%). The textbook computer version of Thomas Schelling’s 1971 idea.

Data

This example doesn’t download any data. Reference: T. C. Schelling, ‘Dynamic models of segregation’, Journal of Mathematical Sociology 1(2), 143–186 (1971)