
- 日付2026-03-12
- 読了時間5分
- 共有リンクをコピー
Last fall, we previewed Imagine with Claude: a new way for Claude to build visuals in real time, without any code. We’re now bringing a version of this feature, in beta, to Claude’s chat conversations. Claude can create custom charts, diagrams and other visualizations in-line in its responses—and then tweak and modify its creations as the conversation develops.
Claude’s conversations already include artifacts: permanent tools and documents created by Claude, designed to be shared or downloaded as more polished work. By contrast, these charts, diagrams and visualizations serve a different purpose: Claude builds them to aid users’ understanding as it’s discussing the topic at hand. They appear in-line, rather than in a side panel, and they’re temporary—they change or disappear as the conversation evolves.
Here are a couple of examples. You can ask Claude how compound interest works, and it’ll give you a curve to play around with. Or you can ask about the periodic table, and it’ll build an interactive visualization in which you can click around for more details, as in the example below:
This feature will be on by default. Claude will decide when to build a visual for something, or you can ask it to do so directly (with a query like “draw this as a diagram” or “visualize how this might change over time”). Once Claude has created something, you can ask for adjustments or to dig in deeper.
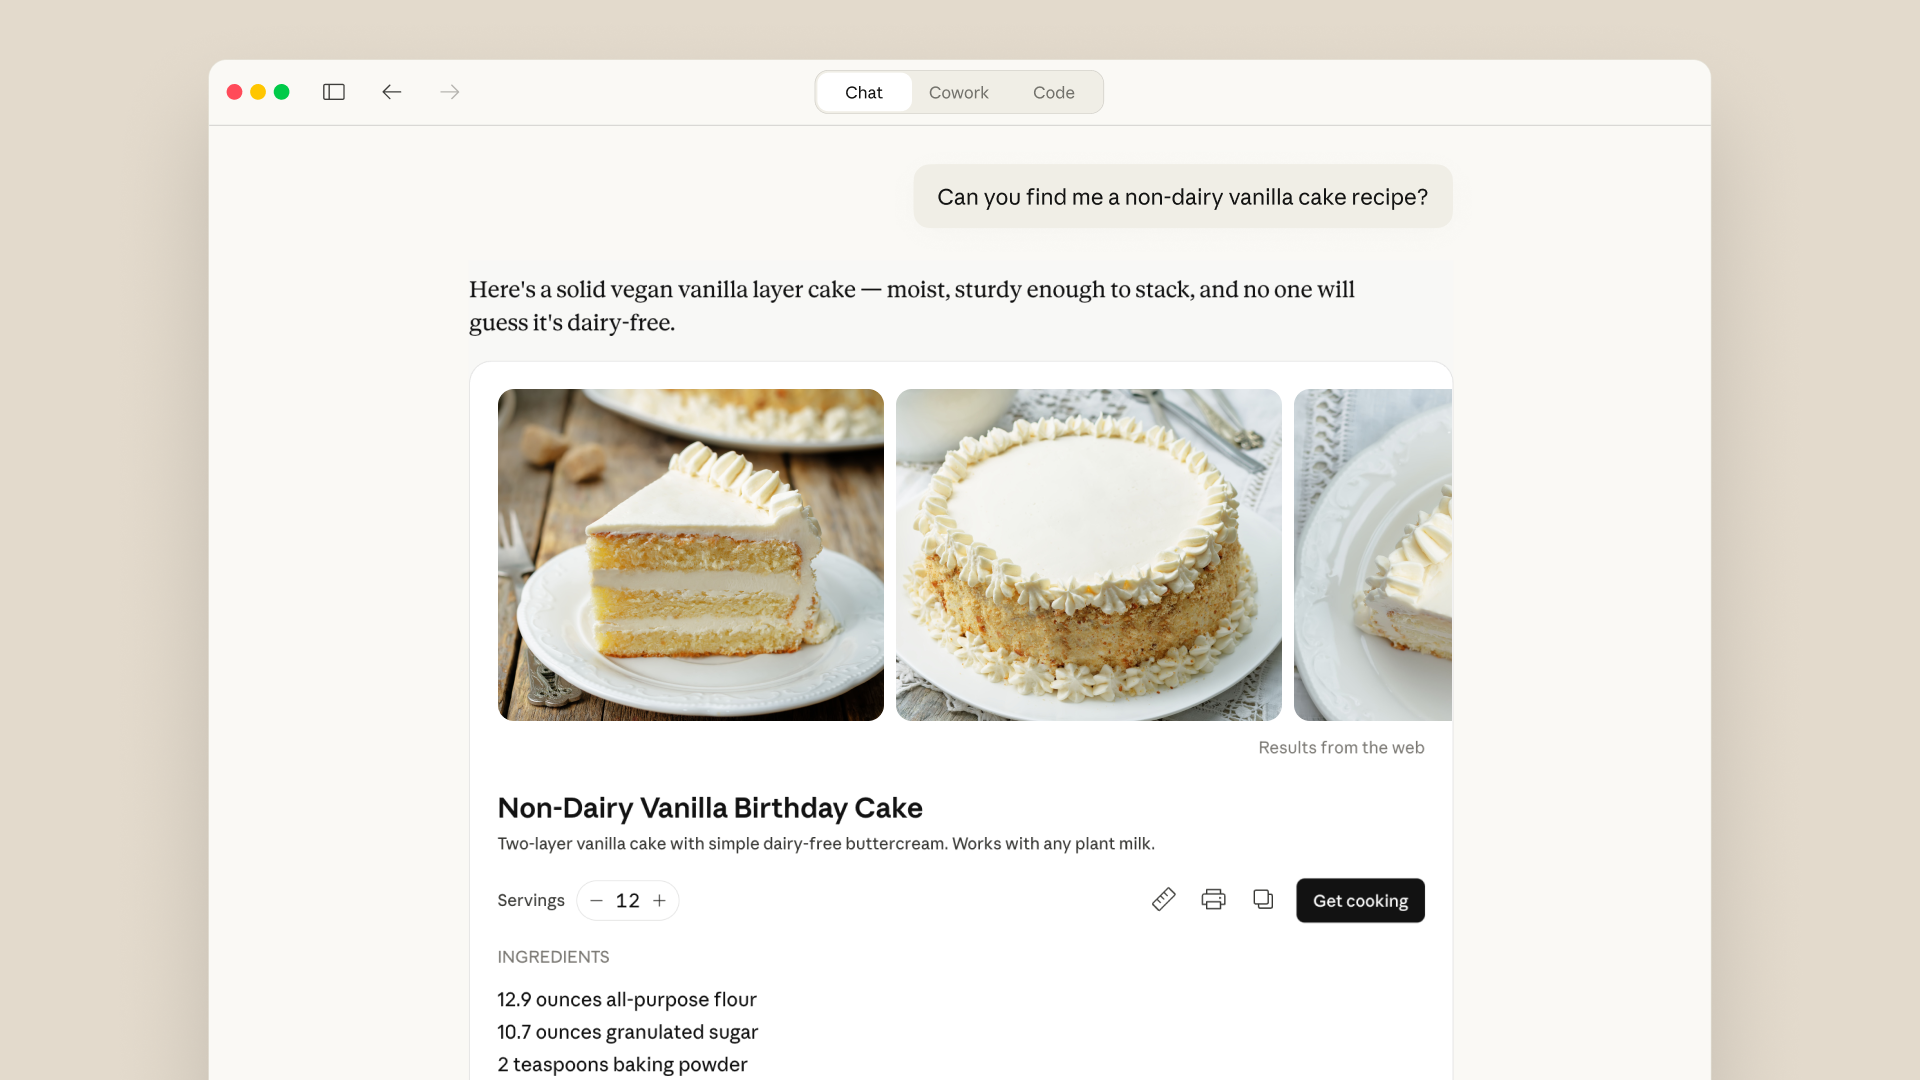
These visuals are part of a broader set of improvements we’ve made to Claude’s responses recently. Earlier this year, Claude began using purpose-designed formats for some topics: recipes, for example, now appear with ingredients and steps, and Claude provides a visual when you ask it for the weather. You can also interact directly with apps like Figma, Canva, and Slack within your discussions.
Try it today. This feature is available on all plan types.
電子ブック


開発を始める
開発者向けニュースレターを入手
製品の最新情報、操作方法、コミュニティスポットライトなどを掲載しています。毎月受信トレイにお届けします。