Pull metrics from analytics dashboards
Claude in Chrome can navigate your analytics dashboards, extract the numbers you need, and compile them into a summary. No exports, no tab-switching, no manual copying.
Claude navigates your analytics dashboards—Amplitude, Mixpanel, or other tools—and extracts the metrics you specify. It reads the same reports you would, pulls the numbers, and compiles them into a summary you can paste into a team update or Slack.
Specify which metrics matter and from which tools. Claude handles the navigation and extraction.
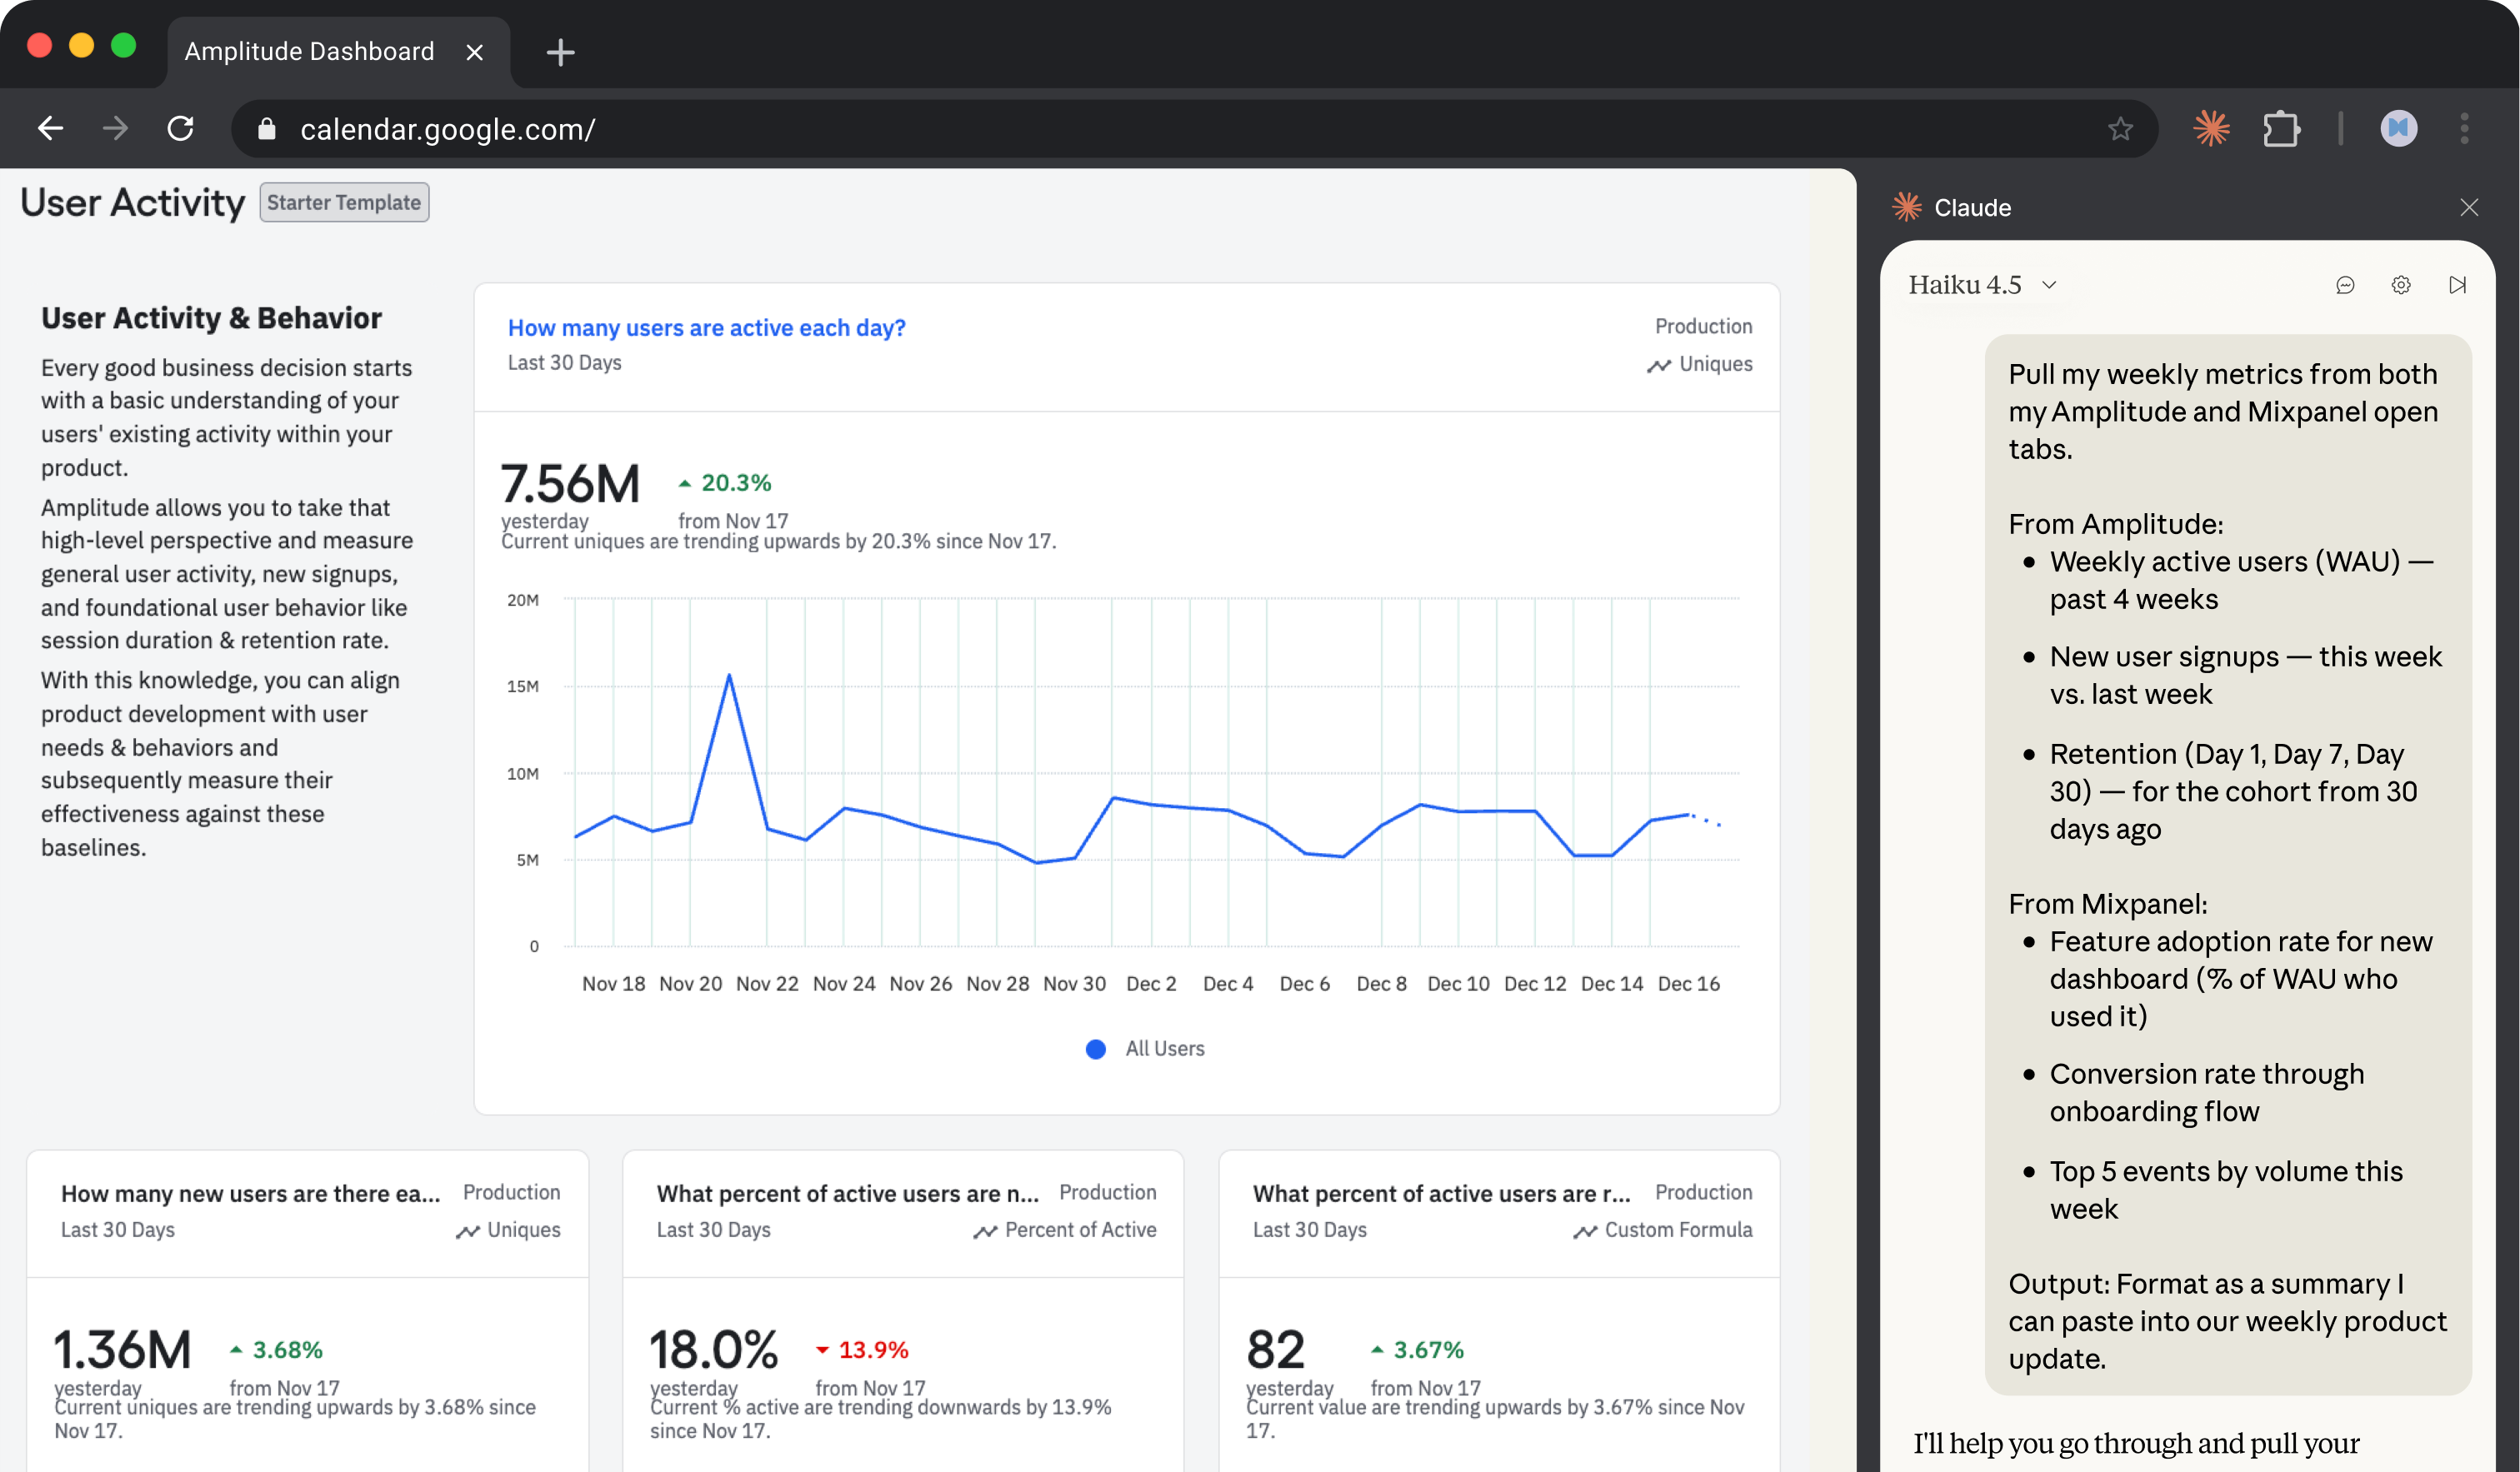
Pull my weekly metrics from both my Amplitude and Mixpanel open tabs.
From Amplitude:
From Mixpanel:
Output: Format as a summary I can paste into our weekly product update.
Claude uses browser use to navigate your analytics tools through your existing browser sessions. If you're logged into Amplitude and Mixpanel, Claude can access the same dashboards and reports you see—no API keys or integrations to configure.
Log into your analytics tools in Chrome before starting. Claude navigates to the dashboards and reports using your sessions.

If you have saved dashboards or reports in your analytics tools, mention them by name. Claude can navigate directly to a saved report rather than building queries from scratch.
Claude compiles metrics from both tools into a single summary.
Weekly Product Metrics Summary
User Growth
Source: Amplitude
WeekWAUChange4 weeks ago24,312—3 weeks ago25,891+6.5%2 weeks ago26,455+2.2%This week27,102+2.4%
Key Stats:
Feature Engagement
Source: Mixpanel
Top Events This Week:
EventCountDashboard viewed45,221Report exported12,847Filter applied11,293Team member invited4,891Integration connected3,442
Summary for Your Update
WAU grew 11.5% over the past month to 27.1K. New signups are up 14% week-over-week. The new dashboard is seeing solid adoption at 34% of active users. Retention remains steady with 23% of users still active at Day 30.
Have Claude investigate before you share the report and get more detail when something looks off.
The onboarding conversion dropped from 78% last week. Can you go into Mixpanel and show me where in the flow people are dropping off? I need to understand this before the meeting.
Once your summary is ready, have Claude format it and post it directly to your team channel.
This looks good. Can you turn it into a few bullet points and post it to #product-weekly in Slack? Just the highlights and anything that changed significantly.
Pull in another data source without starting over. Claude can look in a new tab and add to your summary.
Can you also pull our revenue metrics from Stripe? I need MRR, new subscriptions this week, and churn rate. Add them to the summary.
Click the clock icon in the extension panel to schedule this workflow. Set it to run Monday morning and Claude will have your metrics summary ready before your weekly product sync. No more scrambling to pull numbers before the meeting.
For multi-tool metrics, drag Amplitude, Mixpanel, and any other dashboards into Claude's tab group. You'll see a green banner confirming Claude can access all of them. Now Claude reads across every tool simultaneously—no manual switching.
Once you have a metrics pull that covers what you need, save it as a shortcut by clicking on the shortcut icon below a successful prompt. You can also set a schedule for when you want the workflow to run next. Alternatively, manually trigger the workflow, by typing "/" and selecting the shortcut.
If Claude asks for permission on every dashboard page, go to Settings → Permissions and enable "Always allow actions on this site" for Amplitude, Mixpanel, and other trusted work tools. Persistent access speeds up multi-page navigation significantly.